🧱 四段骨架(照这个写)
· Para 1 引言:用同义替换把题目改写一句(The two pie charts compare the units of electricity produced by fuel source in Australia and France in 1980 and 2000.)
· Para 2 Overview:不写数字,只说大势——澳大利亚以煤炭为主,法国转向核能;两国石油/天然气占比都大幅下降
· Para 3 主体1(澳大利亚):写煤炭占主导,石油/天然气骤减,水电略增
· Para 4 主体2(法国):写核能跃升为主,化石能源锐减,煤炭稳定
✍️
你的完整静态图小作文(四段,约 150 词):
🙈 写完再点:完整参考范文(澳法电力,先自己写,别偷看!)
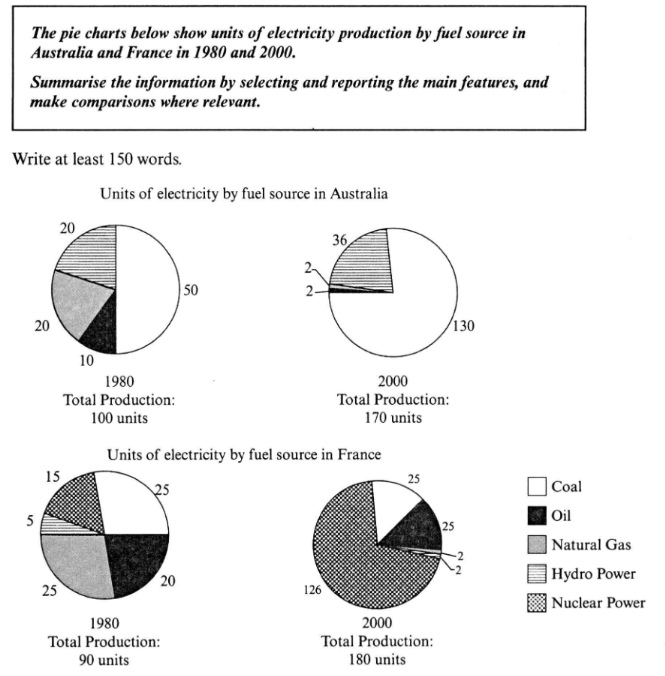
The two pie charts compare the units of electricity produced by five fuel sources in Australia and France in 1980 and 2000.
Overall, coal was the dominant source in Australia, while nuclear power became the main source in France. It is clear that both countries saw a significant shift away from oil and natural gas over the period.
In Australia, coal accounted for the largest share in both years, rising from 50 units in 1980 to 130 units in 2000. By contrast, oil and natural gas each fell sharply to just 2 units in 2000, while hydro power increased from 20 to 36 units.
In France, nuclear power saw the most dramatic growth, soaring from 15 units in 1980 to 126 units in 2000 and overtaking coal as the leading source. Meanwhile, oil and natural gas each dropped to 2 units, and coal remained stable at 25 units.