中文:尽管制作成本下降,该产品的销量仍稳定在每月 1 万台左右。 ⚡ 必须用到:remain stable at
5
中文:与五年前相比,电动汽车的销量增长了两倍(翻了三倍)。 ⚡ 必须用到:compared with + triple(d)
6
中文:该地区人口在 1990 至 2010 年间始终在 200 万到 250 万之间波动。 ⚡ 必须用到:fluctuate between ... and
Part 4 · 完整线图小作文(一篇 Task 1)
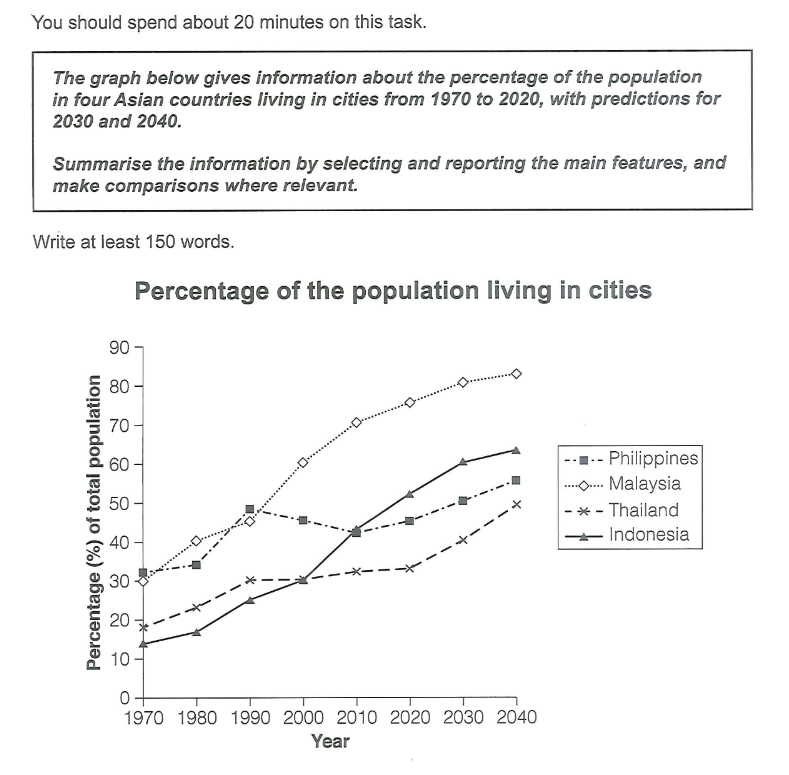
观察下图(剑桥雅思 18 Test 1),写一篇完整的线图小作文——包含 引言段 + Overview 段 + 两个主体段,字数 150 词左右。把前面 Part 1–3 练的趋势词、介词、对比句型都用上。
🧱 四段骨架(照这个写)
· Para 1 引言:用同义替换把题目改写一句(The line graph illustrates / gives information about the proportions of ...)
· Para 2 Overview:不写数字,只说大势——四国城市人口比例全都上升;马来西亚始终最高;印尼增速最快;泰国最低
· Para 3 主体1:写上升最明显的两个(Malaysia、Indonesia),用 rose / climbed / soared + 具体数据
· Para 4 主体2:写另两个(Philippines、Thailand),或做一组对比,至少用一次 compared with / whereas / overtook
✍️
你的完整线图小作文(四段,约 150 词):
🙈 写完再点:完整参考范文(先自己写,别偷看!)
The line graph illustrates the proportions of people living in cities in four Asian countries — Malaysia, Indonesia, the Philippines and Thailand — from 1970 to 2040.
Overall, the urban population rose in all four nations over the period. Malaysia remained the most urbanised throughout, while Thailand stayed the least; Indonesia experienced the fastest growth.
In Malaysia, the figure climbed steadily from about 30% in 1970 to around 75% in 2020, and is projected to reach nearly 90% by 2040. Indonesia saw the most dramatic increase, soaring from roughly 15% to over 55% and overtaking the Philippines in the early 2000s.
By contrast, the Philippines fluctuated between 30% and 45%, whereas Thailand increased more modestly, from about 15% to just under 40%.