← 返回课件列表

📊 雅思写作强化课第3课

小作文第三讲 · 静态数据三图(饼图 / 表格 / 综合图)· 占比、排名、归并与总结

强化课 3/8 · 小作文第三讲
🔥
四类图一张卡记牢:今天收口"静态数据"
图表核心考什么时态最常用表达
线图 Line时间的趋势变化过去时rose / fell / peaked / tripled
柱图 Bar同类别横向比较过去时higher than / the highest / twice as...as
饼图 Pie同一整体的占比分配一般现在时accounted for / made up / the largest share
表格 Table多维度的静态数值对比一般现在时/过去时ranked first / top / bottom / exceed
📌 今天的主线:线图、柱图已经讲完(变化 / 比较)。本课把静态数据三图一次讲透——饼图(占比)、表格(多维)、综合图(两图组合)。它们的共同点:数据不随时间变,所以写法从"趋势"彻底切换到"占比 / 排名 / 归并"。
💡 综合图(Multiple / Combined chart)就是两张图放一起(如饼图+柱图、线图+饼图),本质是把前面学的写法拼起来,再加一句"两图怎么关联"的连接句。今天先建立感觉,下节课(第4课)再专攻流程图、地图等特殊图形
🥧
先看真题饼图:英国学校三年支出变化

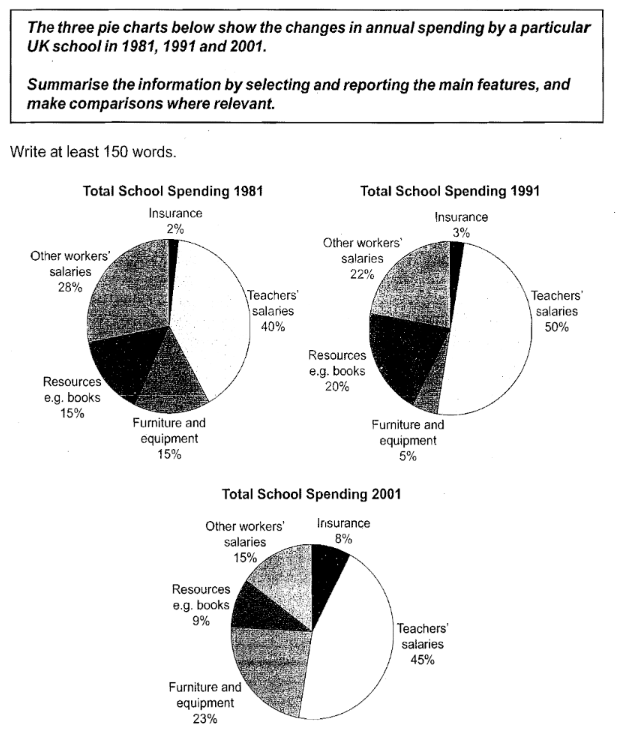
题目:The three pie charts below show the changes in annual spending by a particular UK school in 1981, 1991 and 2001.(英国某学校三年支出构成变化)

UK school spending 1981 1991 2001
🤔 看图先想三件事(中文想一遍就行):
① 每一年里哪项支出最大哪项最小? ② 从 1981 到 2001,哪项变化最大(升还是降)? ③ 能不能把五项支出分成两类(如人员成本 vs 非人员成本)?
这三问的答案,就是后面 Overview 段的骨架。饼图的"魂"就是占比 + 变化
📚
静态图"武器库":占比 / 排名 / 归并
① 占比动词(最基础)
英文中文例句(饼图)
account for占(比例)Teachers' salaries accounted for 40% of total spending in 1981.
make up构成 / 占Resources made up only 9% in 2001.
represent占 / 代表Insurance represented a mere 2% in 1981.
comprise / constitute构成 / 组成The five categories comprised 100% of the school's budget.
② 份额名词(描述"多少")
英文中文用法提示
the largest share最大份额Teachers' salaries had the largest share in all three years.
the majority大多数Staff costs formed the majority of spending.
a minority少数Insurance remained a minority.
the remainder剩余部分The remainder was divided among resources, furniture and insurance.
the bulk主体 / 大半The bulk of spending went on teachers' and other workers' salaries.
③ 排名 / 最值(表格最爱考)
英文中文例句(表格)
rank first / top the list排第一The UK ranked first in coffee sales in 2004.
come second / be next排第二Switzerland came second with €6m.
at the bottom垫底Sweden was at the bottom in both coffee and bananas.
exceed超过UK coffee sales exceeded those of the other four countries combined.
④ 归并 others + ⑤ 数值表达
功能英文例句
归并小块the remaining / combined / the restThe remaining three items combined accounted for 60%.
数值(句首)accounting for X% / at X% / with X%Teachers' salaries, accounting for 40%, were the largest category in 1981.
数值(句末)making up X% / standing at X%Other workers' salaries followed, making up 28%.
⑥ 占比大小副词(修饰差异)
副词含义例句
by far远远地Teachers' salaries were by far the largest item.
significantly显著地Furniture and equipment spending significantly exceeded insurance costs in 2001.
slightly / marginally略微 / 微弱地Insurance rose only marginally from 2% to 3% between 1981 and 1991.
✍️
把"占比 + 变化"写成四种高分句型
句型1:A + accounted for + 最大占比
结构Teachers' salaries accounted for the largest proportion of spending, at 40% in 1981.
句型2:A + made up X%, followed by B(梯队)
结构Teachers' salaries made up 40% in 1981, followed by other workers' salaries (28%) and resources (15%).
句型3:While A …, B …(对比并列,体现变化)
结构While teachers' salaries rose from 40% to 50% between 1981 and 1991, spending on furniture and equipment fell from 15% to 5%.
📌 While / Whereas 放句首 + 逗号,是静态图最稳的"一边升一边降"对比写法。
句型4:归并 others(收尾利器)
结构The remaining four items (other workers, resources, furniture and insurance) combined accounted for 60% in 1981. | The rest was split among the smaller categories.
✂️ 一句话四种写法·合并示范(同一事实)
事实:教师工资在三年中始终占比最大,1991 年达到峰值 50%

① Teachers' salaries accounted for the largest share, reaching 50% in 1991.
② Teachers' salaries made up 40% / 50% / 45%, followed by other workers' salaries; insurance came bottom at 2%-8%.
While teachers' salaries peaked at 50% in 1991, insurance remained the smallest item at just 3%.
④ Teachers' salaries were by far the largest, whereas insurance made up a mere 2% in 1981.
📋
表格:多维数据别逐格写,抓"极值 + 变化"

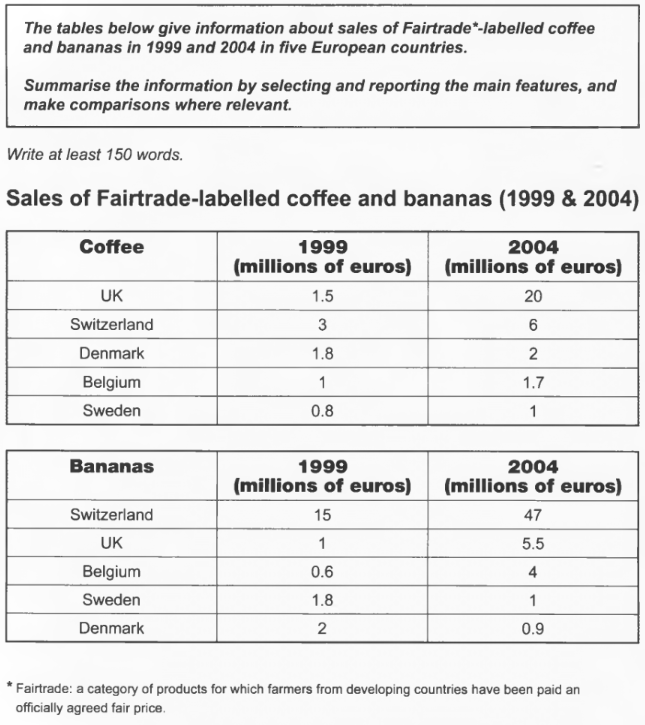
题目:The tables below give information about sales of Fairtrade-labelled coffee and bananas in 1999 and 2004 in five European countries.(五个欧洲国家 Fairtrade 咖啡/香蕉销售额,单位:百万欧元)

Fairtrade coffee and bananas sales
📌 表格的"坑":格子多,千万别把 20 个数字全写一遍!考官只看你会不会挑极值 + 找变化
✅ 抓三点:① 谁最大 / 谁最小(排名) ② 哪格变化最明显(UK 咖啡从 1.5→20,瑞士香蕉 15→47) ③ 整体趋势(2004 年整体销售远高于 1999)。
表格描述句型示范
排名In 2004, the UK ranked first in coffee sales at €20 million, while Sweden was at the bottom at just €1 million.
变化Between 1999 and 2004, UK coffee sales rose sharply from €1.5m to €20m — by far the largest increase.
归并The remaining countries each recorded coffee sales of below €7m in 2004.
🔗
真题综合图:饼图 + 表格,先各写各、再"连"一句

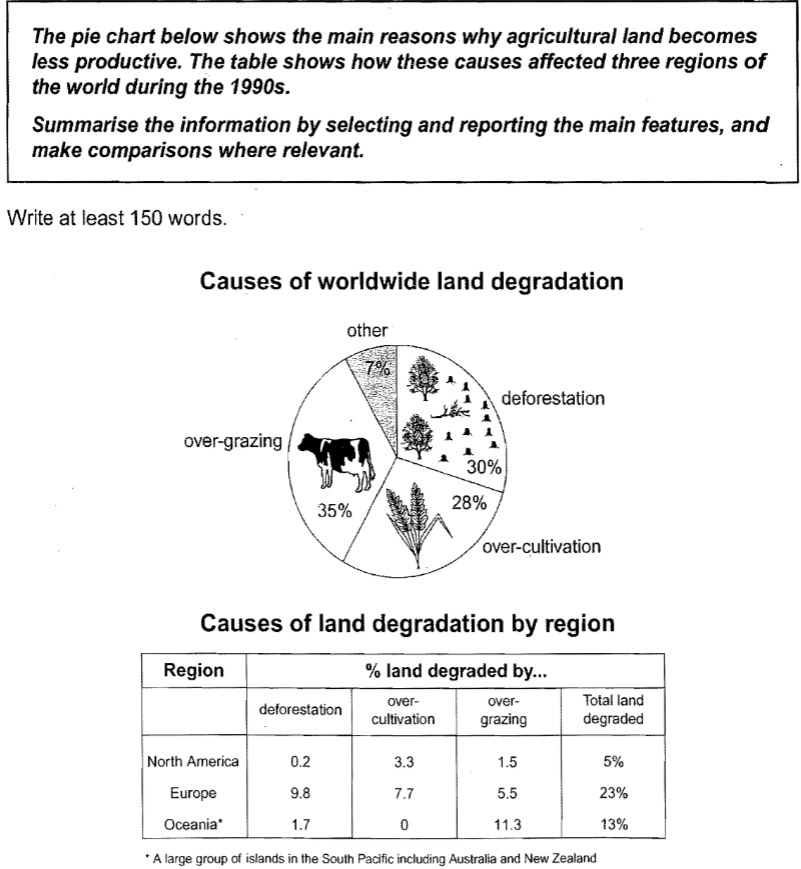
题目:The pie chart below shows the main reasons why agricultural land becomes less productive. The table shows how these causes affected three regions of the world during the 1990s.

Land degradation causes and by region
💡 综合图写法三步
图1 单独写(全球土地退化原因占比)
图2 单独写(三大地区受影响程度)
加一句"连接":点出两图的关系(全球主因在地区层面的体现)
核心不是"更难的图",而是别漏掉任何一张图——两张都要覆盖到。
两图连接句型
并列While the pie chart shows the main causes of worldwide land degradation, the table reveals how these causes affected three regions in the 1990s.
因果The two charts reveal a clear link: over-grazing and over-cultivation, which together accounted for 63% of global land degradation, were also the dominant causes in Oceania and Europe.
印证Both charts point to the same pattern — over-grazing was the leading cause globally (35%) and also the main factor in Oceania (11.3%).
💬
完整表达句库(直接套用,不用自己拼)
🏷️ ① 开头引入(改写题目 / 点出图的类型)
The three pie charts compare the distribution of annual spending by a UK school in 1981, 1991 and 2001.
The two tables provide figures for Fairtrade-labelled coffee and bananas sales in five European countries in 1999 and 2004.
The two charts show both the main causes of land degradation and their regional impact in the 1990s.
It is clear from the charts that one category dominated the overall picture.
📊 ② 数据描述(占比 / 排名 + 具体数字)
Teachers' salaries accounted for the largest share, at 40% of total spending in 1981.
Other workers' salaries followed closely behind, making up 28% in 1981.
The UK ranked first in coffee sales in 2004, at €20 million, while Sweden was at the bottom.
Over-grazing accounted for the largest proportion of land degradation, at 35%, followed by deforestation (30%).
The remaining three causes combined represented just 35%.
⚖️ ③ 对比分析(高低 / 变化 / 反差)
While teachers' salaries rose from 40% to 50%, spending on furniture and equipment fell from 15% to 5%.
In stark contrast to the UK's coffee sales growth, Sweden's sales remained below €1.5m.
Between 1999 and 2004, UK coffee sales surged from €1.5m to €20m, whereas Denmark's sales rose only marginally.
By contrast, Europe had the highest total land degradation (23%), while North America recorded only 5%.
🏁 ④ 总结结论(Overview / Conclusion)
Overall, the school's spending fell into two broad groups: staff costs and other items.
It is clear that staff costs accounted for the majority of the budget, while insurance remained the smallest item.
In summary, although teachers' salaries led, the share of furniture and equipment saw the most dramatic change.
To sum up, the two charts show that over-grazing was the leading cause of land degradation and affected Oceania most severely.
🧭
静态图通用三步:归类 → Overview → 主体段
第一步:数据归类——按"大小 / 类别"分组
✅ 以英国学校支出(1991)为例归类:
· 人员成本(大):Teachers' salaries 50% + Other workers' salaries 22% = 72%
· 非人员成本(小):Resources 20% + Furniture 5% + Insurance 3% = 28%
· 或按变化:Teachers' salaries ↑ / Furniture and equipment ↓↓ / Insurance ↑ / Others 混合
👉 主体段就照"人员成本 vs 非人员成本"或"从大到小"写,别逐项流水账
第二步:写 Overview——全文最重要的 2–3 句
✅ 英国学校支出 Overview 范例(背下骨架):
Overall, staff costs (teachers' and other workers' salaries) accounted for the majority of spending in all three years, while resources, furniture and insurance made up a smaller proportion. It is clear that teachers' salaries were by far the largest single category, and furniture and equipment saw the most dramatic change, rising from 15% to 23% after a fall to 5%.

👆 两句概况(分组+极值+最显著变化),Overview 不写具体过程,只点"谁大谁小、怎么变"。

第三步:主体段——归类后填"数据 + 占比词"
Overview 定框架,主体段填细节。每段 = 主题句(分组/排名)+ 占比句(带数字)+ 对比/变化
举主体段示范:
Staff costs made up the bulk of the budget. Teachers' salaries accounted for the largest share, at 40% in 1981, followed by other workers' salaries (28%). The former rose to a peak of 50% in 1991 before easing to 45% in 2001, while the latter fell steadily to 15%. By contrast, non-staff costs were a minority, although furniture and equipment spending recovered from 5% in 1991 to 23% in 2001.
控制练习:占比 / 排名 / 归并(英国学校支出语境)
Part A · 选出正确的占比 / 排名表达(小测)

👉 点选项,绿色=对,红色=错。

Teachers' salaries accounted for 40% of total spending in 1981.
Teachers' salaries risen 40% of total spending in 1981.
Teachers' salaries ranked first in all three years.
Insurance topped the list of spending.
The remaining four categories combined made up 60% in 1981.
The remained four categories combined made up 60% in 1981.
Part B · 挖空填词(点击显示答案)

👉 先自己想,再点橙色块看答案。

Teachers' salaries accounted for the largest share (40% in 1981), followed by other workers' salaries (28%). While teachers' salaries rose to 50% in 1991, spending on furniture and equipment fell to just 5%. The remaining three categories together represented 28%.

Part C · 中译英(占比句 ×6,点开看参考)
1
1981 年教师工资占该校支出的最大比例,达到 40%。
建议:accounted for / the largest proportion
📝 看参考答案
Teachers' salaries accounted for the largest proportion of the school's spending in 1981, at 40%.
2
其他工作人员工资位居第二,1981 年占 28%,紧随教师工资之后。
建议:ranked second / followed by
📝 看参考答案
Other workers' salaries ranked second, making up 28% in 1981, closely followed by teachers' salaries.
3
虽然教师工资在 1991 年升至 50%,但家具和设备支出骤降至 5%。
建议:While / fell sharply
📝 看参考答案
While teachers' salaries rose to 50% in 1991, spending on furniture and equipment fell sharply to 5%.
4
其余三项支出(资源、家具设备、保险)合计占 1981 年总支出的 35%。
建议:The remaining / combined accounted for
📝 看参考答案
The remaining three items combined accounted for 35% of total spending in 1981.
5
总体而言,人员成本在所有三年中都占学校支出的绝大部分。
建议:Overall / the bulk of
📝 看参考答案
Overall, staff costs made up the bulk of the school's spending in all three years.
6
这三张饼图揭示了一个明显转变:支出从日常资源逐步转向教师工资和基础设施。
建议:reveal a clear shift / infrastructure
📝 看参考答案
The three pie charts reveal a clear shift: spending moved away from day-to-day resources toward teachers' salaries and infrastructure.
📝
15 分钟课堂限时写作:土地退化综合图

📌 用模块六的真题综合图(全球土地退化原因 + 1990s 三大地区影响)写一篇完整 Task 1。写完后导出 txt 交作业。

Land degradation causes and by region
⏱ 课堂限时写作
15:00
最后 1 分钟会变红提醒;到点请停笔、检查后导出。
✍️ 你的静态图小作文(完整一篇,4 段)
0 词 / 0 字
🙈 写完再点:参考范例(先自己写,别偷看!)
Overview: Overall, over-grazing was the leading cause of land degradation worldwide, while deforestation and over-cultivation accounted for slightly smaller proportions. Europe had the highest total proportion of degraded land, whereas North America was the least affected.
Body 1: Over-grazing accounted for the largest share at 35%, followed by deforestation (30%) and over-cultivation (28%). The remaining 7% was attributed to other causes.
Body 2: In terms of regional impact, Europe had the highest total land degradation at 23%, with deforestation (9.8%) and over-cultivation (7.7%) being the main contributors. By contrast, North America recorded only 5% in total. Oceania stood at 13%, where over-grazing was particularly severe at 11.3%, while over-cultivation had no impact.
Conclusion: The two charts reveal that over-grazing and deforestation were the dominant causes globally, but their regional effects varied considerably.

👆 引言改写 + Overview 写主因+地区极值 → Body1 饼图占比(从大到小) → Body2 表格地区(极值+对比) → 收尾连接句。把"两张图都写到 + 加一句连接"执行到底。

📌 第3课核心口诀(静态图 · 占比 / 排名 / 归并)
占比 account for / make up / represent / comprise
份额 the largest share / the majority / the remainder
排名 rank first / top the list / at the bottom / exceed
归并 the remaining ... combined / the rest / the bulk
对比 While / Whereas 放句首,Overview 只说分组不写数字
综合图:两张都写到 + 加一句"两图怎么关联"

📝 课后任务

🤖 每日英文写作表达补充(用元宝或其他AI助手的定时功能)

继续用元宝(或其他AI助手)的定时推送功能,本周专攻占比与排名表达。

推送指令填:"每天推送一个雅思小作文静态图表达(如 account for / rank first / the remainder / combined),包括:①英文原词 ②中文意思 ③一个完整例句"